The Enabling Technologies of OCT Angiography
Optical Coherence Tomography (OCT) angiography opens another exciting chapter in ophthalmic imaging. Based on motion contrast, and in the presence of motion-less structure, OCT angiography (OCT-A) resolves signal due to moving blood flow. It thereby offers a compelling alternative to fluorescein angiography (FA) for the visualization of vascular abnormalities without the need for injections of contrast dye. Areas of perfusion, or indeed non-perfusion, are readily apparent in the images, and information regarding blood flow and microvasculature can be seen within different vascular beds, as opposed to FA that offers only a single 2d perspective. So vasculature can not only be seen and isolated within different plexi of the retina, it can be observed in the choriocapillaris and deep into the choroid. It is likely, therefore, given that retinal vascular diseases are the leading cause of blindness, this technology will have significant clinical impact in the coming years.
To supplement regular OCT, there is an emphasis in OCT-A on three enabling technologies:
- Motion Correction
- Signal Decorrelation
- Layer Segmentation
In the following we give a brief overview of each of these topics and demonstrate in detail the contribution from 3), layer segmentation.
Motion Correction
If the motion contrast detected in OCT-A imaging is to be derived only from blood-flow, the data must be acquired from a motionless body. That is, the structural information seen in the regular OCT data, which corresponds to anatomy, must be free of motion. As volumetric OCT can take around two seconds to acquire, a fair amount of motion can occur. The duration of OCT-A data is around four times that as the motion decorrelation algorithms require data from the same location at different time points in order to detect motion of the red blood cells.
Ensuring that the surrounding anatomy is held to be static for the analysis is the task of motion correction algorithms that either operate in real-time during the acquisition [1], or as a post-processing step [2]. In both cases, anatomical landmarks are used to register the image data as it is collected. Additional sources of information such as line-scanning ophthalmoscope (LSO) images are used to appropriately guide the OCT raster as it “paints” a motion free area [3]. Being effectively instantaneous, the LSO image is held to be the ground-truth of a motionless en face view of the OCT data. The OCT beam shares its coordinate system with the LSO and motion is tracked based on registering landmarks in the frame-rate LSO data.
The downside here is that, based on the motion, the acquisition time can be longer as areas may be repeatedly scanned until the full field of view (FOV) is covered. This can extend time on the chin rest for patients with poor fixation ability or impeded motion.
The post-processing approach rasters in orthogonal directions, and, importantly, uses just the OCT A-scans to perform the correction after the acquisition [2]. This puts a finite limit on the time taken to acquire the data. It also means that the device does not require an additional LSO camera and display, reducing the cost to manufacture, a benefit that gets passed on to the consumer. The multiple collected OCT volumes – typically four – are aligned on a per A-scan basis, constrained to optimize a global (across all A-scans) optimization function that uses a single displacement field for each volume. By scanning twice orthogonally in one direction and then the other, each acquired volume has at least two fast scanning directions, where the fast direction is relatively motion free. The unknown is an assumed smoothly varying displacement vector, as a function of time, which is used to model and correct the motion. The objective function used is based on the difference between the corresponding orthogonal volumes (as they should be the same), and the smoothness of displacement vector is used as a regularizer. The minimization involves using multi-resolution optimization as its surface, in what is a very large parameter space, is non-convex.
Signal Decorrelation
Given multiple volumes (at least four) of a motion free OCT data set, signal decorrelation is used to detect motion contrast. There are three main approaches to generating signal due to motion contrast in OCT: those based on the magnitude of the OCT signal alone [3]; those based on the phase of the OCT signal alone [4]; and those using both [5].
Of these, only two approaches have been commercialized. The first is the split-spectrum amplitude-decorrelation angiography (SSADA) algorithm developed at Oregon Health and Science University (OHSU) by Dr.’s Yali Jia and David Huang [3]. In using amplitude information alone, it avoids the requirement of good phase stability, which is difficult to achieve given bulk motion artifact from the axial direction. It splits the OCT data into different spectral bands, computes the decorrelation, and averages the result back across all bands. The use of multiple bands prevents speckle signal being smeared out as it has a frequency dependency so decorrelation requires a band-pass approach.
The second commercialized approach uses both the phase and magnitude information. The use of the doppler shift to look at the blood flow has been around for some time. The problem with this is the sensitivity to the angle; i.e., the beam is in the axial direction, yet blood flow is transverse, so the sensitivity to detecting flow is very low. The particles moving inside the blood vessel modulate the OCT signal, presenting an opportunity to contrast the blood flow. This is done again with registered B-scans, but the difference of the complex signal is taken instead of intensity decorrelation [5].

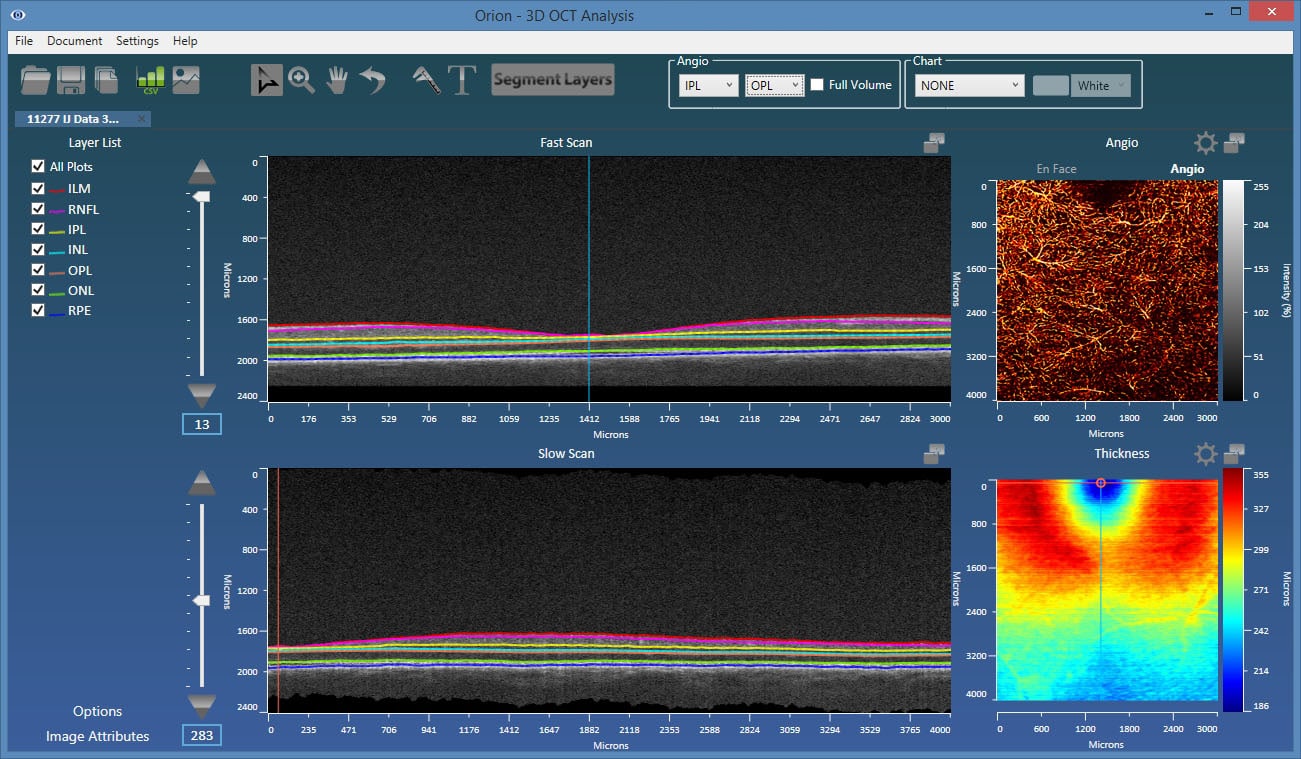
Layer Segmentation
The angiography images are viewed in 2d, from the en face perspective. This requires taking some function of the processed data in the axial dimension. For example, we could simply sum the results, or perhaps take the maximum value. A key advantage to OCT-A over FA is, however, the fact that we can view data emanating from individual vascular beds. Each of these are bounded by retinal layer interfaces, requiring, therefore, retinal layer segmentation to appropriately bound the data.
The plexi of primary interest are:
- Superficial plexus – from the inner limiting membrane (ILM) to the posterior of the inner plexiform layer (IPL).
- Deep inner plexus – from the posterior of the IPL to the posterior of the outer plexiform layer (OPL).
- Outer retina plexus – from the posterior of the OPL to the posterior of the retinal pigment epithelial (RPE) layer. This region is avascular, so any blood flow showing up here would be considered neovascularization.
- Choriocapillaris – in this location, we would ideally limit the integration range to 50 microns from Bruch’s membrane. Typically, however, Bruch’s membrane is hard to visualize, so a baseline-RPE approach is used.
As such, accurate and robust layer segmentation is the final key enabling technology for OCT-A. Without appropriate bounds on the plexi, the resulting angiography data can be misleading, and one of the most important advantages over FA – namely, the ability to single out and look within isolated vascular beds – is lost. Our Orion software natively supports OCT-A, and also offers important advantages over the typical device software that may only offer two or three segmentation layers. As figures 1 and 2 show, the results are extremely revealing!
References
[1] For example, TruTrackTM (Heidelberg Engineering, Heidelberg, Germany) and FastTracTM (Carl Zeiss Meditec Inc., Dublin, CA). [2] Kraus MF, Potsaid B, Mayer MA, Bock R, Baumann B, Liu JJ, Hornegger J, Fujimoto JG. Motion correction in optical coherence tomography volumes on a per A-scan basis using orthogonal scan patterns. Biomed Opt Express. 2012 Jun 1;3(6):1182-99. [3] Jia Y, Tan O, Tokayer J, Potsaid B, Wang Y, Liu JJ, Kraus MF, Subhash H, Fujimoto JG, Hornegger J, Huang D. Split-spectrum amplitude-decorrelation angiography with optical coherence tomography.Opt Express. 2012 Feb 13;20(4):4710-25.
[3] M.C. Pierce, B. Hyle Park, B. Cense, J.F. de Boer. Simultaneous intensity, birefringence, and flow measurements with high-speed fiber-based optical coherence tomographyOpt. Lett., 27 (2002), pp. 1534–1536.
[4] Wang RK. Optical Microangiography: A Label Free 3D Imaging Technology to Visualize and Quantify Blood Circulations within Tissue Beds in vivo.IEEE J Sel Top Quantum Electron. 2010 May;16(3):545-554.