Voxeleron at ARVO 2018

With ARVO upon us, we’d like to take the opportunity to reach out, reconnect, and pass on some news and updates. We hope that these are of interest and, better still, that we can meet up at ARVO. You can either visit us at our booth (#928) or come to one of our posters (details below). We’re very much looking forward to this meeting, and not just because it is in Honolulu!
OrionTM Updates
While our OCT analysis application has undergone a number of iterative changes, the big release this year is our change analysis software, a direct result of receiving a Phase I Small Business Innovation Research (SBIR) grant from the National Institutes of Health’s (NIH) National Center for the Advancement of Translational Sciences (NCATS). Such funding developed OCT as a modality – a fantastic story in itself – so we are proud recipients of this award, the results of which will be demonstrated first at ARVO.
Introducing TimeLineTM
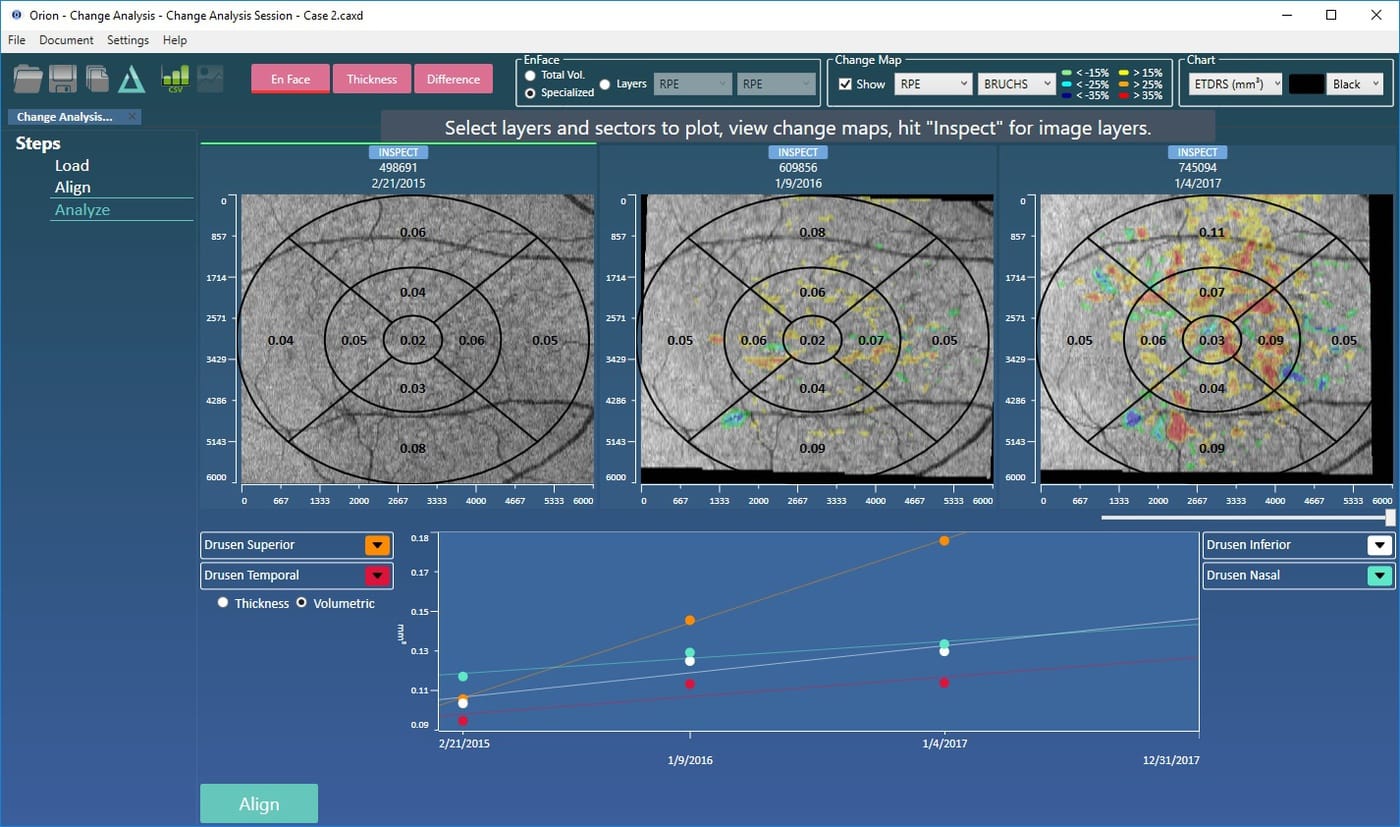
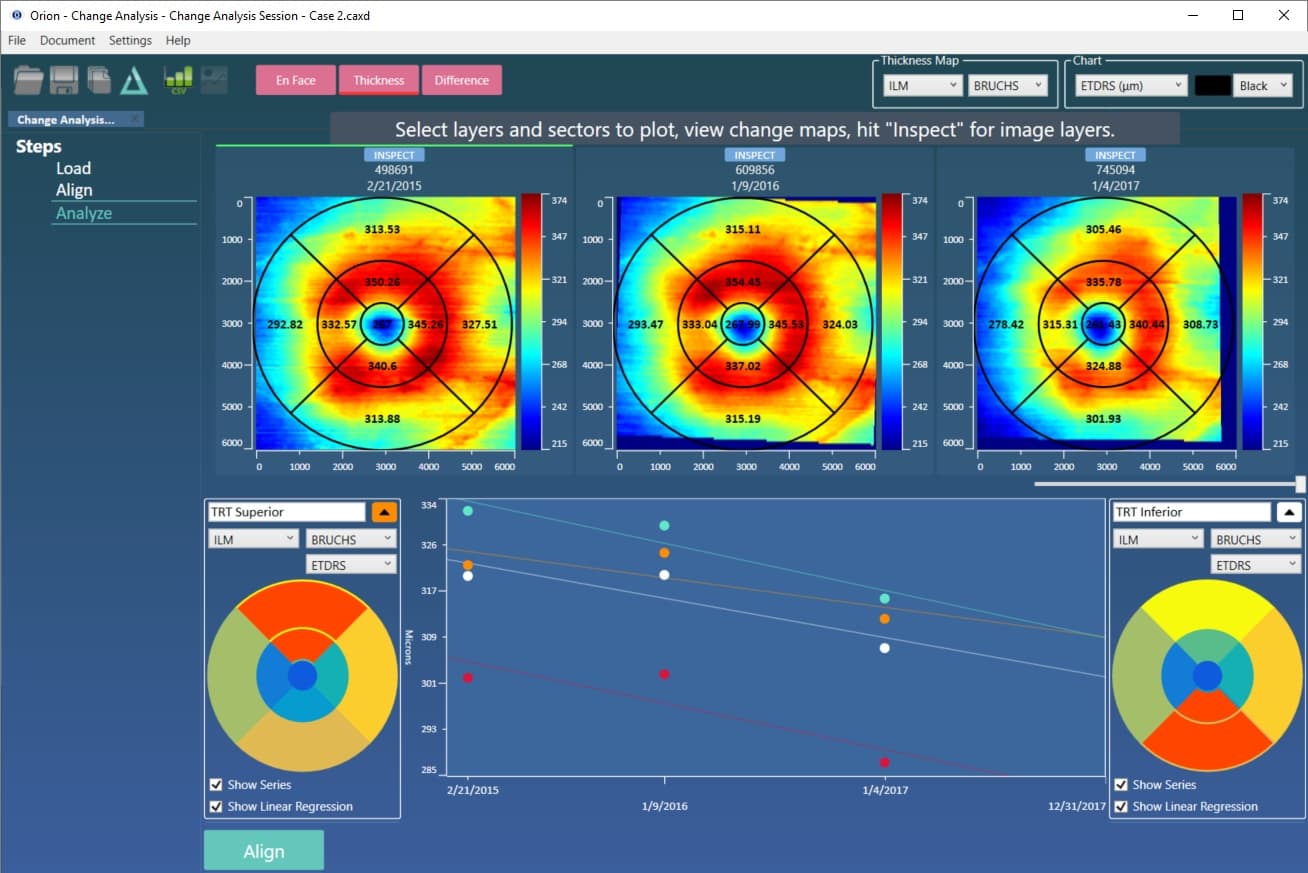
As with Orion in general, we have really focused on ensuring the technology fits workflow, making analyses easy and fast. Indeed, workflow was our watchword for segmentation, layer editing, and batch processing. And, for longitudinal analysis, we like to think the new functionality is easy as 1-2-3, namely:
- Hit “Load” and select the volumes to analyze.
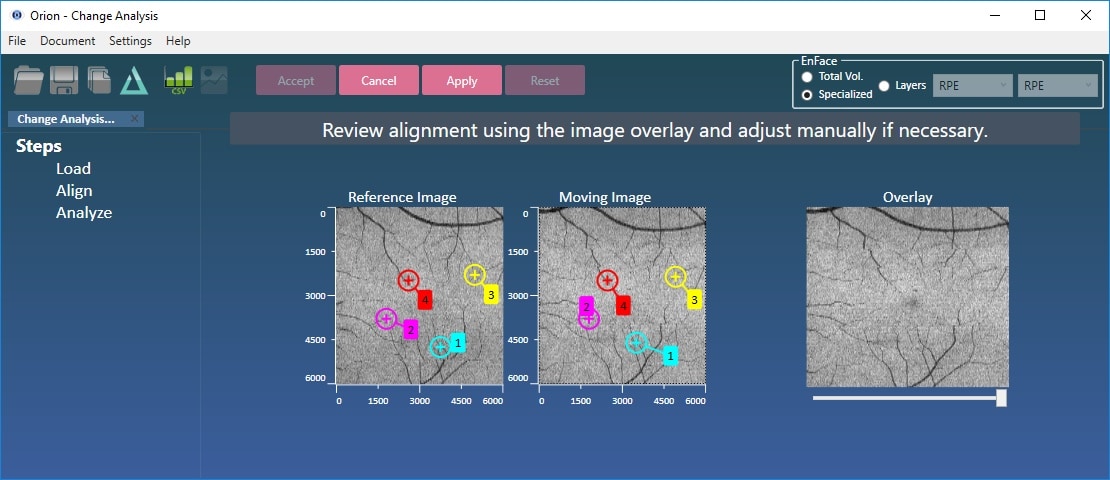
- Hit “Align”.
- Hit “Analyze”. Thereafter, the analysis is highly customizable in accordance to the user’s preferences and analysis goals:
- This can mean exporting all the results to a single spreadsheet, or plotting the different summary parameters over time.
- Any combination of thickness/volume and sector (ETDRS or Quadrant) is possible using an active selection map .
As well as being supported by the NIH, our software has been developed with clinical support from IDIBAPS (Dr. Pablo Villoslada), ICOF (Dr. Javier Zarranz-Ventura), UCL and Moorfields (Dr. Pearse Keane). This is not an exhaustive list of collaborators, but these are the key personnel who helped get things going, so thank you!
OCT data can contain significant motion artifact and pathological changes that can require manual intervention. That’s included as, however bad the data is, it’s sometimes vital to be able to conclude the analysis.
ARVO Posters
This year we’re involved directly in three posters and there are three others that use Orion. The topics are pretty broad, spanning AMD, diabetes, MS, glaucoma and Alzheimer’s.
Relevance and Validation of Optical Coherence Tomography based on Volumetric Measures in Age-Related Macular Degeneration
(Session 340, B0330). Ali Lamin1, Jonathan Oakley, Adam Dubis1, Susan Lightman1, Sobha Sivaprasad1 (1UCL/Moorfields).
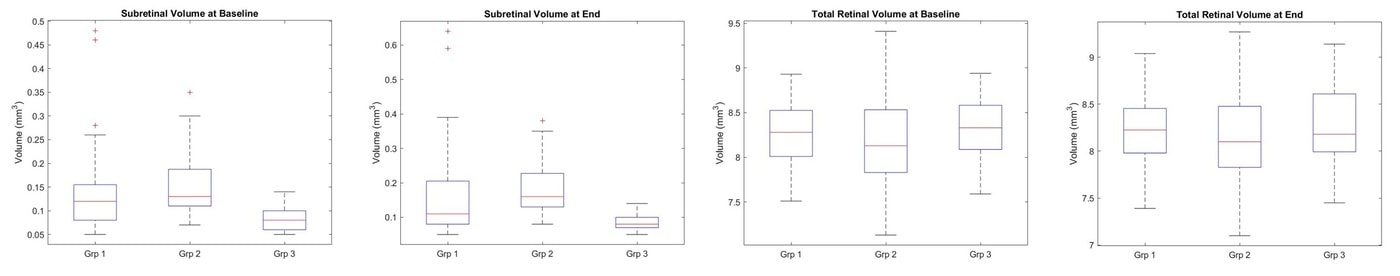
This poster looks at AMD patients that progress from dry to wet over a two year period before the conversion occurs. It compares their OCT structural parameters using Orion to each other and also healthy controls taken over the same period. While subretinal volume measured between the retinal pigment epithelial (RPE) layer and Bruch’s – so sub-RPE – within the ETDRS circle differentiates well AMD patients from healthy controls, total retinal volume does not. Subretinal volume as defined could not, in this study, separate the two AMD types, so was not helpful in informing us on the patients who are more at risk of converting to the more aggressive form of AMD. This did, however, prompt us to dig deeper into the data, as is reported in the next poster.
An aside: Unfortunately, Ali cannot make the meeting due to the travel ban. This is incredibly disappointing and unfair and we sincerely hope that wiser heads and sounder judgement soon prevail.
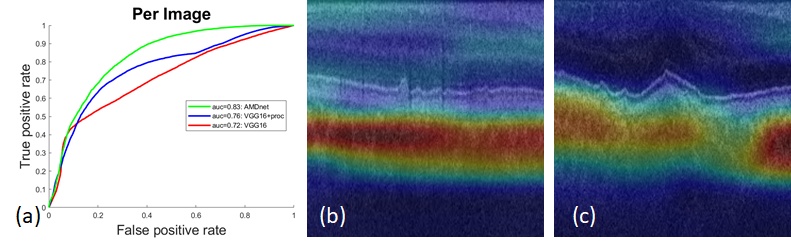
Deep learning for prediction of AMD progression
(Session 240, A0238) Daniel Russakoff, Ali Lamin1, Jonathan Oakley, Adam Dubis1, Susan Lightman1, Sobha Sivaprasad1 (1UCL/Moorfields).
If OCT parameters alone are not indicative of conversion from dry to wet AMD, could more sophisticated parameters and methods of regression do this? In this particular case we asked if a deep learning method could be prognostic. The short answer is yes, with a per patient AUC of 0.88. Put another way, we have asked if we can identify choroidal neovascularization (CNV) subclinically. Given indication that we can, we also asked: where in the data do we see this? From the figure below, this information is clearly found in the choroid and, interestingly, not in the drusen. It is possible, therefore, that the approach taken is a surrogate measure for functional imaging techniques that visualize subclinical CNV using angiography.
As with our previous deep learning work using OCT, key to the method is the preprocessing, as the “normalization” that is added cuts out the irrelevant image data based on the initial segmentation and provides the CNN with a consistent localization of the choroid. Given the exciting results, we plan to continue this work and extend the approach using 3D time-series data. We also plan to see if we can correlate the activation maps shown in the figure below to to flow maps in OCT-A.
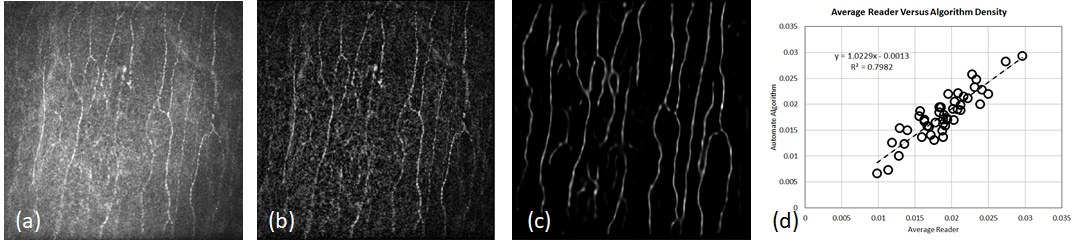
Automated Analysis of In Vivo Confocal Microscopy Corneal Images Using Deep Learning
(Session 242, B1047) Jonathan Oakley, Daniel Russakoff, Rachel Weinberg1, Megan McCarron1, Samuel Brill1, Stuti Misra2, Charles McGhee2, Joseph Mankowski1 (1JHU, 2University of Auckland).
Continuing the deep learning theme, this work further advances the image analysis aspect of the collaboration led by Professor Mankowski at the Johns Hopkins School of Medicine using in vivo confocal microscopy (IVCM) of the cornea. Quantitative measurements of nerve fibers yield important biomarkers for screening and management of sensory neuropathy in diseases such as diabetes mellitus, HIV, Parkinson’s, and multiple sclerosis. The cornea has the densest set of nerves in the entire body making it an ideal candidate for such assessment. IVCM facilitates clinical imaging of the cornea, a method that lacks only robust, automated quantification. To this end, we have replaced our previous nerve fiber detection algorithm with a deep learning approach. This has improved overall performance significantly, and we report on performance in macaque images, a very challenging dataset where previous algorithms, including our own (ARVO 2017), had shown low correlation to manual graders.
This and That
And here are some more updates that didn’t quite warrant their own heading but are noteworthy all the same:
- We were pleased to read the recent publication by Behbehani et al., “Predictors of retinal atrophy in multiple sclerosis: A longitudinal study using spectral domain optical coherence tomography with segmentation analysis”. It uses Orion for analysis that wasn’t otherwise possible using their OCT device software. It can be viewed here.
- Orion changes:
- Angiography support includes the ability to export the raw angio data plexus by plexus. Many researchers are using their own methods for further analysis (e.g., fractal density), so this functionality supports that.
- We added support for Topcon peripapillary RNFL segmentation. These are 2d circular scans centered at the ONH – just like the currently supported Spectralis RNFL scans.
- An addition Optovue scan pattern has been added (512-by-640-by-128). Note that this scan pattern uses our axial motion correction at load time (as does Topcon FDS volumes and Nidek XML volumes).
- By request, we added pan-and-zoom functionality to the intelligent editing views. Makes sense, so we put it in!
- RPE-baseline is now applied in larger Field of View (FOV) scans. Previously, we had limited it to FOVs centered at the fovea of less than 7mm laterally. Given faster scan times, people are imaging increasingly wider areas, so we removed this restriction to support that.
- We’re deprecating orthogonal slice editing! If you’d like to keep that in, do let us know, but the feedback we’ve had is that it has been totally superseded by intelligent editing and that if touch-ups are still needed, slice-by-slice is fine.
- The odd bug fix, speed up and enhancement. You may not even notice...
- We were pleased to be awarded a Stanford Global Health Seed Grant for a submission authored by Dr. Robert Chang of Byers Eye Institute, Stanford University. We’ll be applying AI techniques to the challenging task of glaucoma staging and detection using OCT.